

- Monomorphic VT usually results from the presence of a scar in the myocardium
- In pre-excitation tachycardia since the impulse does not travel through the His-Purkinje system their management is similar to that of VT
- Toxic causes like anti-arrhythmic overdose, TCA overdose and hyperkalemia often are unresponsive to standard treatments for wide complex tachycardia
- Hx of MI, CHF or recent unstable angina increases the likelihood of having VT
- Obtain an 12 lead EKG to rule out pacemaker related WCT or artifacts
- Obtain a prior EKG. If the wide complexes in the current EKG are similar in morphology and axis in all leads to the prior sinus EKG then it is less likely to be VT and more likely to be be SVT

- Determine if the rhythm is irregular or regular.
- Irregular WCT is usually either polymorphic VT, AF with aberrant conduction or AF with WPW. Polymorphic VT should have significant variations in QRS amplitude while AF with aberrant conduction and AF with WPW do not. A rate of > 200 also prefers VT or AF with WPW rather than AF with aberrant conduction.
- Regular WCT could be monomorphic VT, SVT with aberrant conduction, SVT with WPW or pacemaker related tachycardia.
- Apply Griffith EKG Morphology / Axis Criteria
- REGULAR WCT – If the EKG has a classic RBBB and the axis is not NW it is less likely to be VT. If the EKG has a classic LBBB pattern and the axis is not 90-270 (RAD or NW) then it is less likely to be VT.
- IRREGULAR WCT – Look for classic RBBB or LBBB pattern. If this is not present, its more likely to be VT.
- Look for signs of AV dissociation (REGULAR WCT)
- P waves that “march” through the WCT. Best visualized in V1 or inferior leads
- If P waves conduct they can create a FUSION BEAT (combination of supraventricular impulse with ventricular impulse) or CAPTURE BEAT (supraventricular impulse that is conducted through the normal pathways – narrow QRS). The image below shows VT followed by a fusion and two capture beats.

- Entirely positive or negative concordance in precordial leads


Going back to our EKG, the rhythm looks irregular. This is especially clear if you look at lead II. The RR interval is clearly not uniform. Applying the Griffith Morphology Criteria our EKG meets the criteria for LBBB. In addition, the rate is <200 and the QRS amplitude is only minimally variable. All of these points suggest that our underlying rhythm is Afib with pre-excitation or aberrancy. However, Afib with pre-excitation rarely has a QRS that matches LBBB pattern, so it is more likely to be Afib with aberrancy.
In our case, the astute physicians at the bedside noted that the patient’s rate was variable, ranging from 113-150s while at rest. They performed a vagal maneuver which slowed the rate and narrowed the complexes. A repeat EKG confirmed the irregular rate. After a dose of cardizem, the following EKG was obtained.
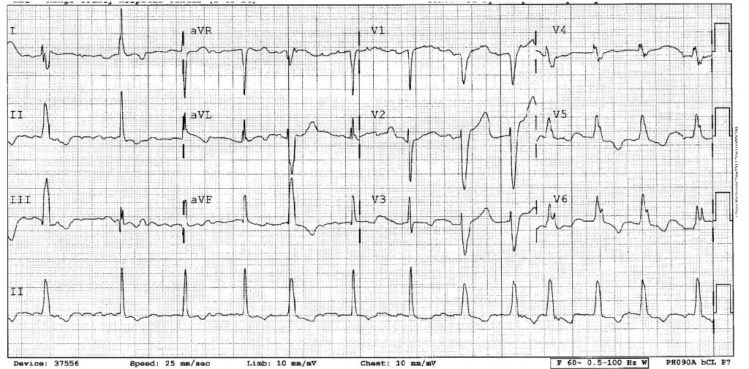
The repeat EKG clearly shows P waves that have a flutter/fib pattern. Going back to our original EKG, although it’s difficult you can see P waves specifically in lead V1 between the 3rd and 4th complexes and the same corresponding P waves in the rhythm strip. The presence of P waves in an EKG that otherwise looks like a wide complex tachycardia narrows our differential to tachycardia of supraventricular origin.
References:
EM Practice June 2008, Vol 10, No. 6. “Wide Complex Tachycardia: Diagnosis and Management in the Emergency Department”
Lifeinthefastlane.com – “VT Versus SVT with Aberrancy” – http://lifeinthefastlane.com/2010/12/vt-versus-svt-with-aberrancy/
nchristopher
Latest posts by nchristopher (see all)
- What’s wrong with this picture? – Answer - September 11, 2013
- What’s wrong with this picture? - August 21, 2013
- EKG Case 8 – Answer - July 16, 2013


0 Comments